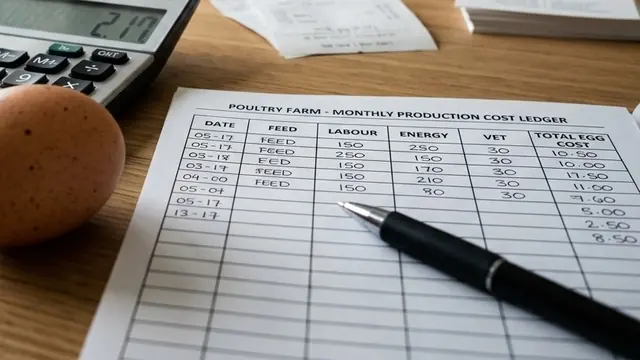

You could track dozens of numbers on a farm, but each week you only need to look at a few key ones. If they’re on target, the farm is working. If one starts to slide, you find out within a week, not at the end of the season. Below — by production type, with links to detailed guides.
Layers
| KPI | How to calculate | What to watch |
|---|---|---|
| Laying rate, hen-day | Eggs per day ÷ live layers × 100 | Against the strain’s standard for the age (more) |
| Feed per egg | Weekly feed ÷ weekly eggs | Usually 130–160 g; a rise means look for losses (norms) |
| Breakage and rejects | Broken and substandard ÷ all eggs × 100 | About 2% is normal; from 5% check shell quality |
| Mortality | Weekly deaths ÷ flock × 100 | Adult layers — up to 0.1–0.25% a week (norms) |
| Cost per egg | All expenses ÷ eggs sold | Against your selling price (more) |
Broilers
| KPI | How to calculate | What to watch |
|---|---|---|
| Average weight | Sample of 30–100 birds | Gap to the strain’s table (how to weigh) |
| Feed conversion | Feed ÷ live weight gain | Worsening week to week (more) |
| Livability | Live ÷ placed × 100 | 95–97% over the cycle in a good flock |
| EPEF | Formula below | Overall flock score |
The EPEF index
The European Production Efficiency Factor rolls weight, livability, age and conversion into one number. It’s handy for comparing flocks.
EPEF = livability, % × average live weight, kg ÷ (age, days × FCR) × 100
Example: 96% livability, 2.5 kg, 40 days, FCR 1.7. EPEF = 96 × 2.5 ÷ (40 × 1.7) × 100 ≈ 353. In commercial conditions 350–400 and above is considered good. On a small farm the figure is usually lower, and what matters more is whether it improves from flock to flock.
For every species
- Water use daily: a drop warns of disease earliest of all (more).
- Water-to-feed ratio: about 1.6–2 at moderate temperatures, more in the heat.
- Feed stock in days: so you don’t run out over a weekend (feed inventory).
How not to drown in numbers
- Pick 4–5 KPIs for your production type.
- Look at them on the same day each week.
- Compare with last week and with the standard, don’t just note them.
- If a figure goes out of range, write down what changed and check again in a week.
KPIs without a calculator
In EggPulse laying rate, conversion, mortality, feed and cost are calculated from daily records, and for broiler flocks so is EPEF. Comparison with last week and the standard is on one screen.